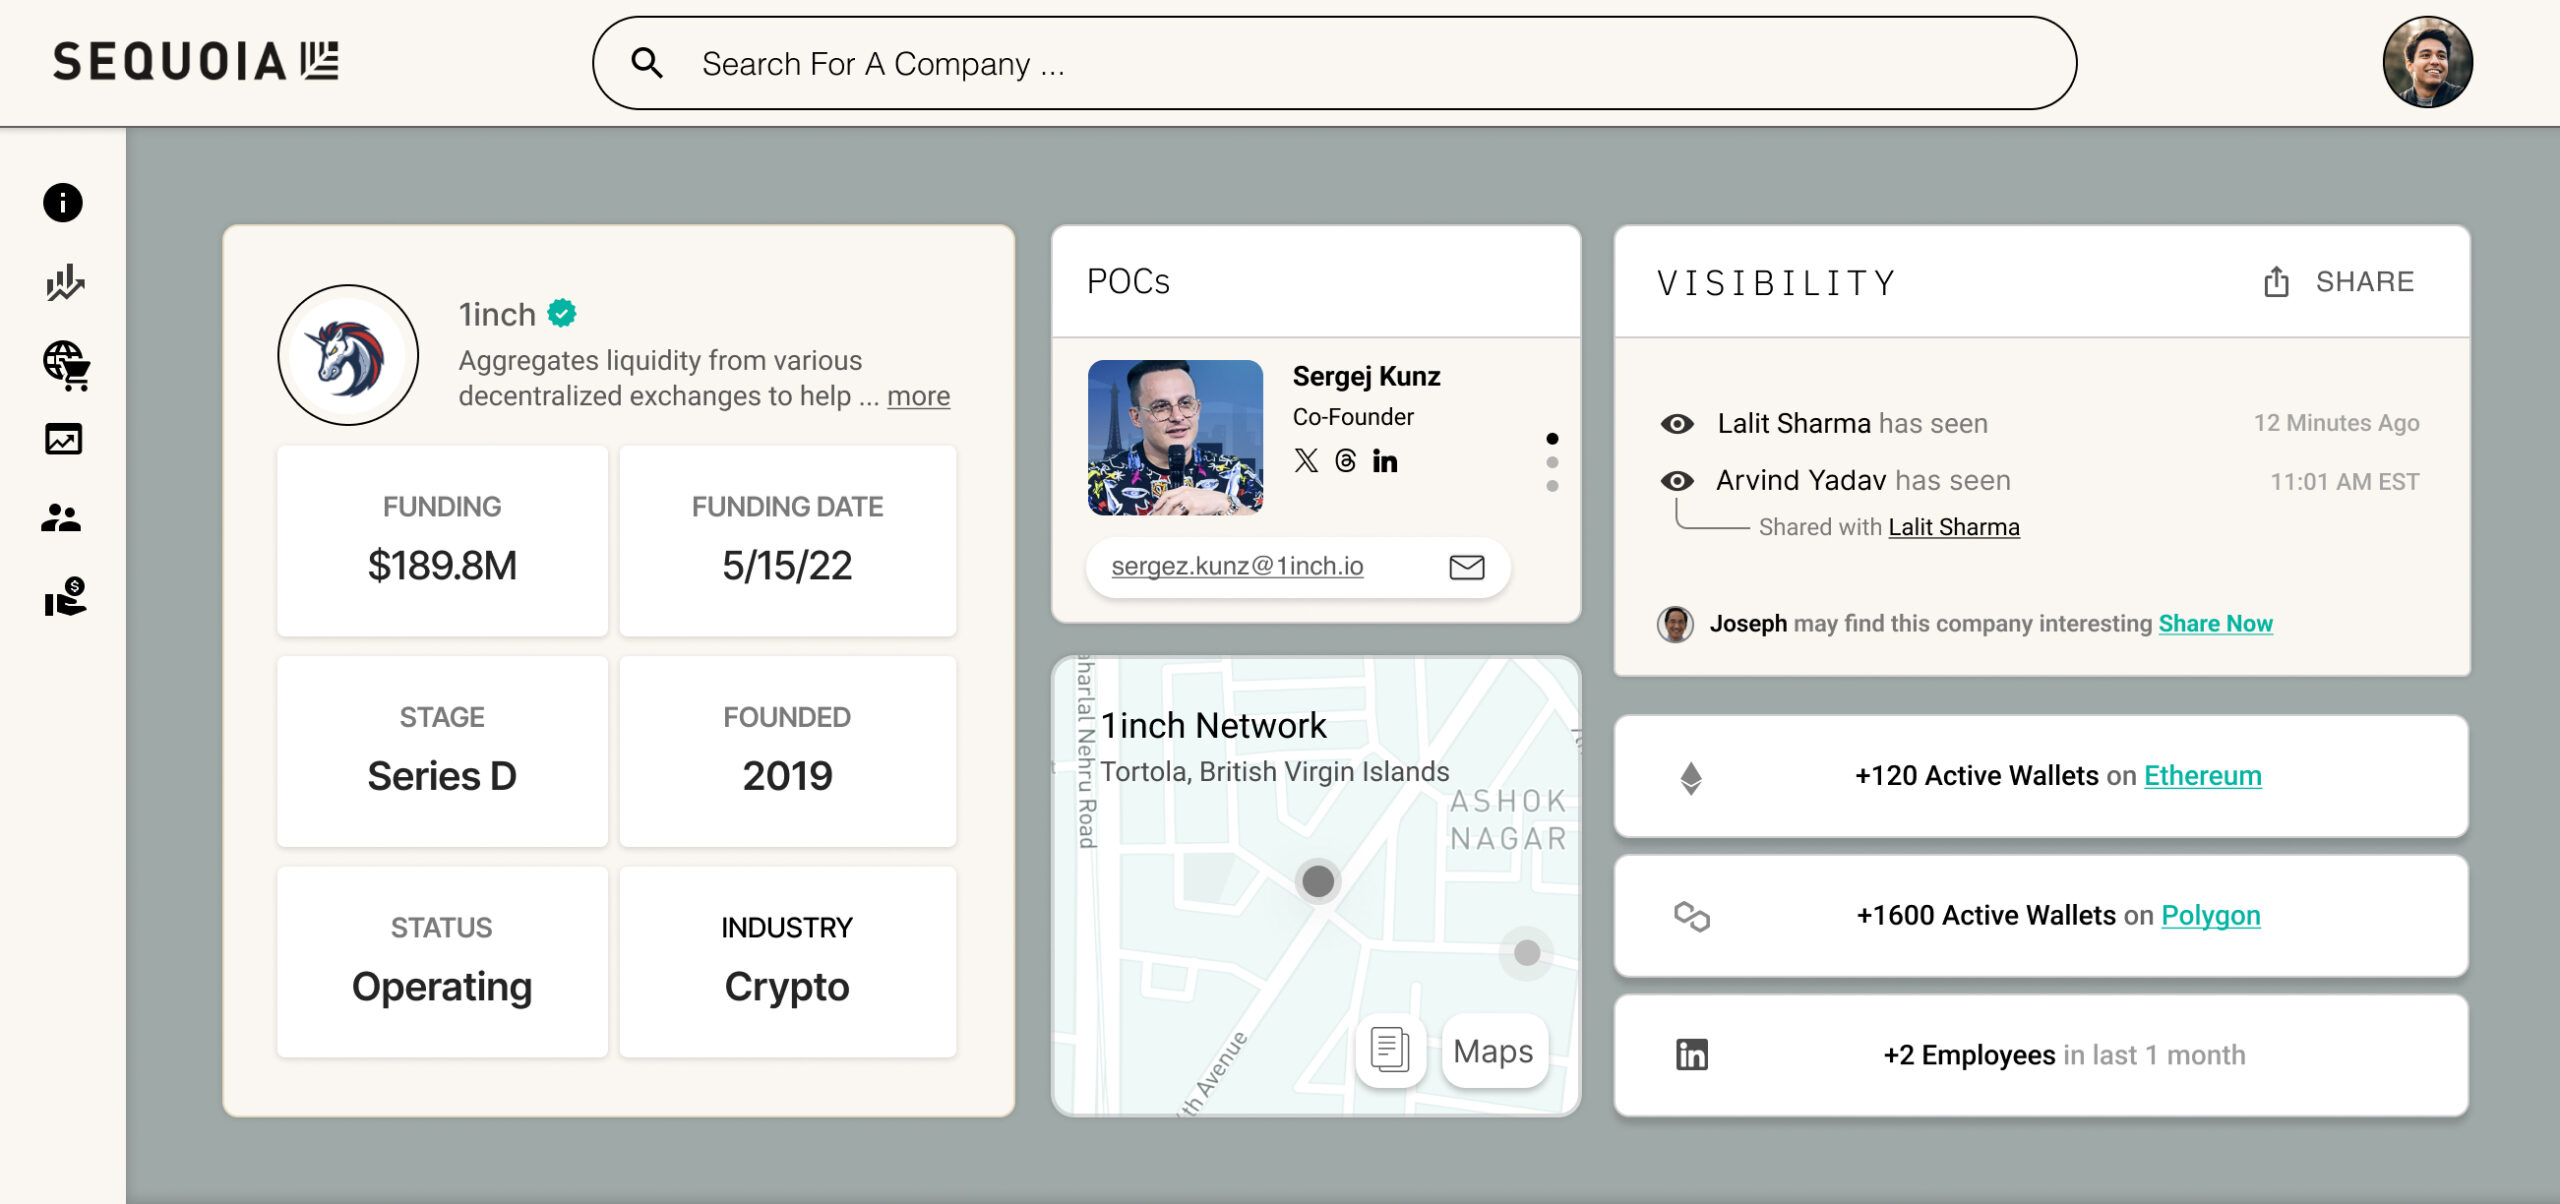
A dedicated module allowing investors to Discover Crypto companies using On-Chain Data associated with the booming crypto economy, with metrics on Active Wallets, TVL and Funding. Each section expands allows hyper-specific actions to engage.
A dedicated module allowing investors to Discover Crypto companies using On-Chain Data associated with the booming crypto economy, with metrics on Active Wallets, TVL and Funding. Each section expands allows hyper-specific actions to engage.
Crypto/Web3 data scraping had just begun – it was time to integrate the future of tech to see what’s really going on in.
Goals
→ Work with Data Science team to structure and organize the data creating hierarchies of relevance.
→ Present data in bite-sized chunks so user has visibility on outer layer + the chance to dive deeper.
→ Review & iterate directly with stakeholders to understand usability for any updates.
Problem: Original UI was a non-intuitive + cluttered , but factual and only geared only towards D2C – allowing the investor to see every bit of information from the database in a vertical scroll. It needed improvements across the board, at the time only devs knew how to interface with the platform appropriately. The end user need to understand what’s going on and this was definitely not going to be scalable towards the Crypto / Web3 data the analysts were wanting to see.
Approach: Sequoia’s investors needed faster and more efficient ways to parse through its data lake to find new company’s to invest in. Each quarter these requirements change, the design for their dashboards had to be iterative, modular, and future-proof.
Solution: Explorer Tool
The first part of the platform to be created was the Explorer tool already geared towards D2C, it allows users to define Categories, Metrics, and Filters to companies across multiple sources. Most importantly it reduced friction across the company since the data team no longer needed to report on metrics.
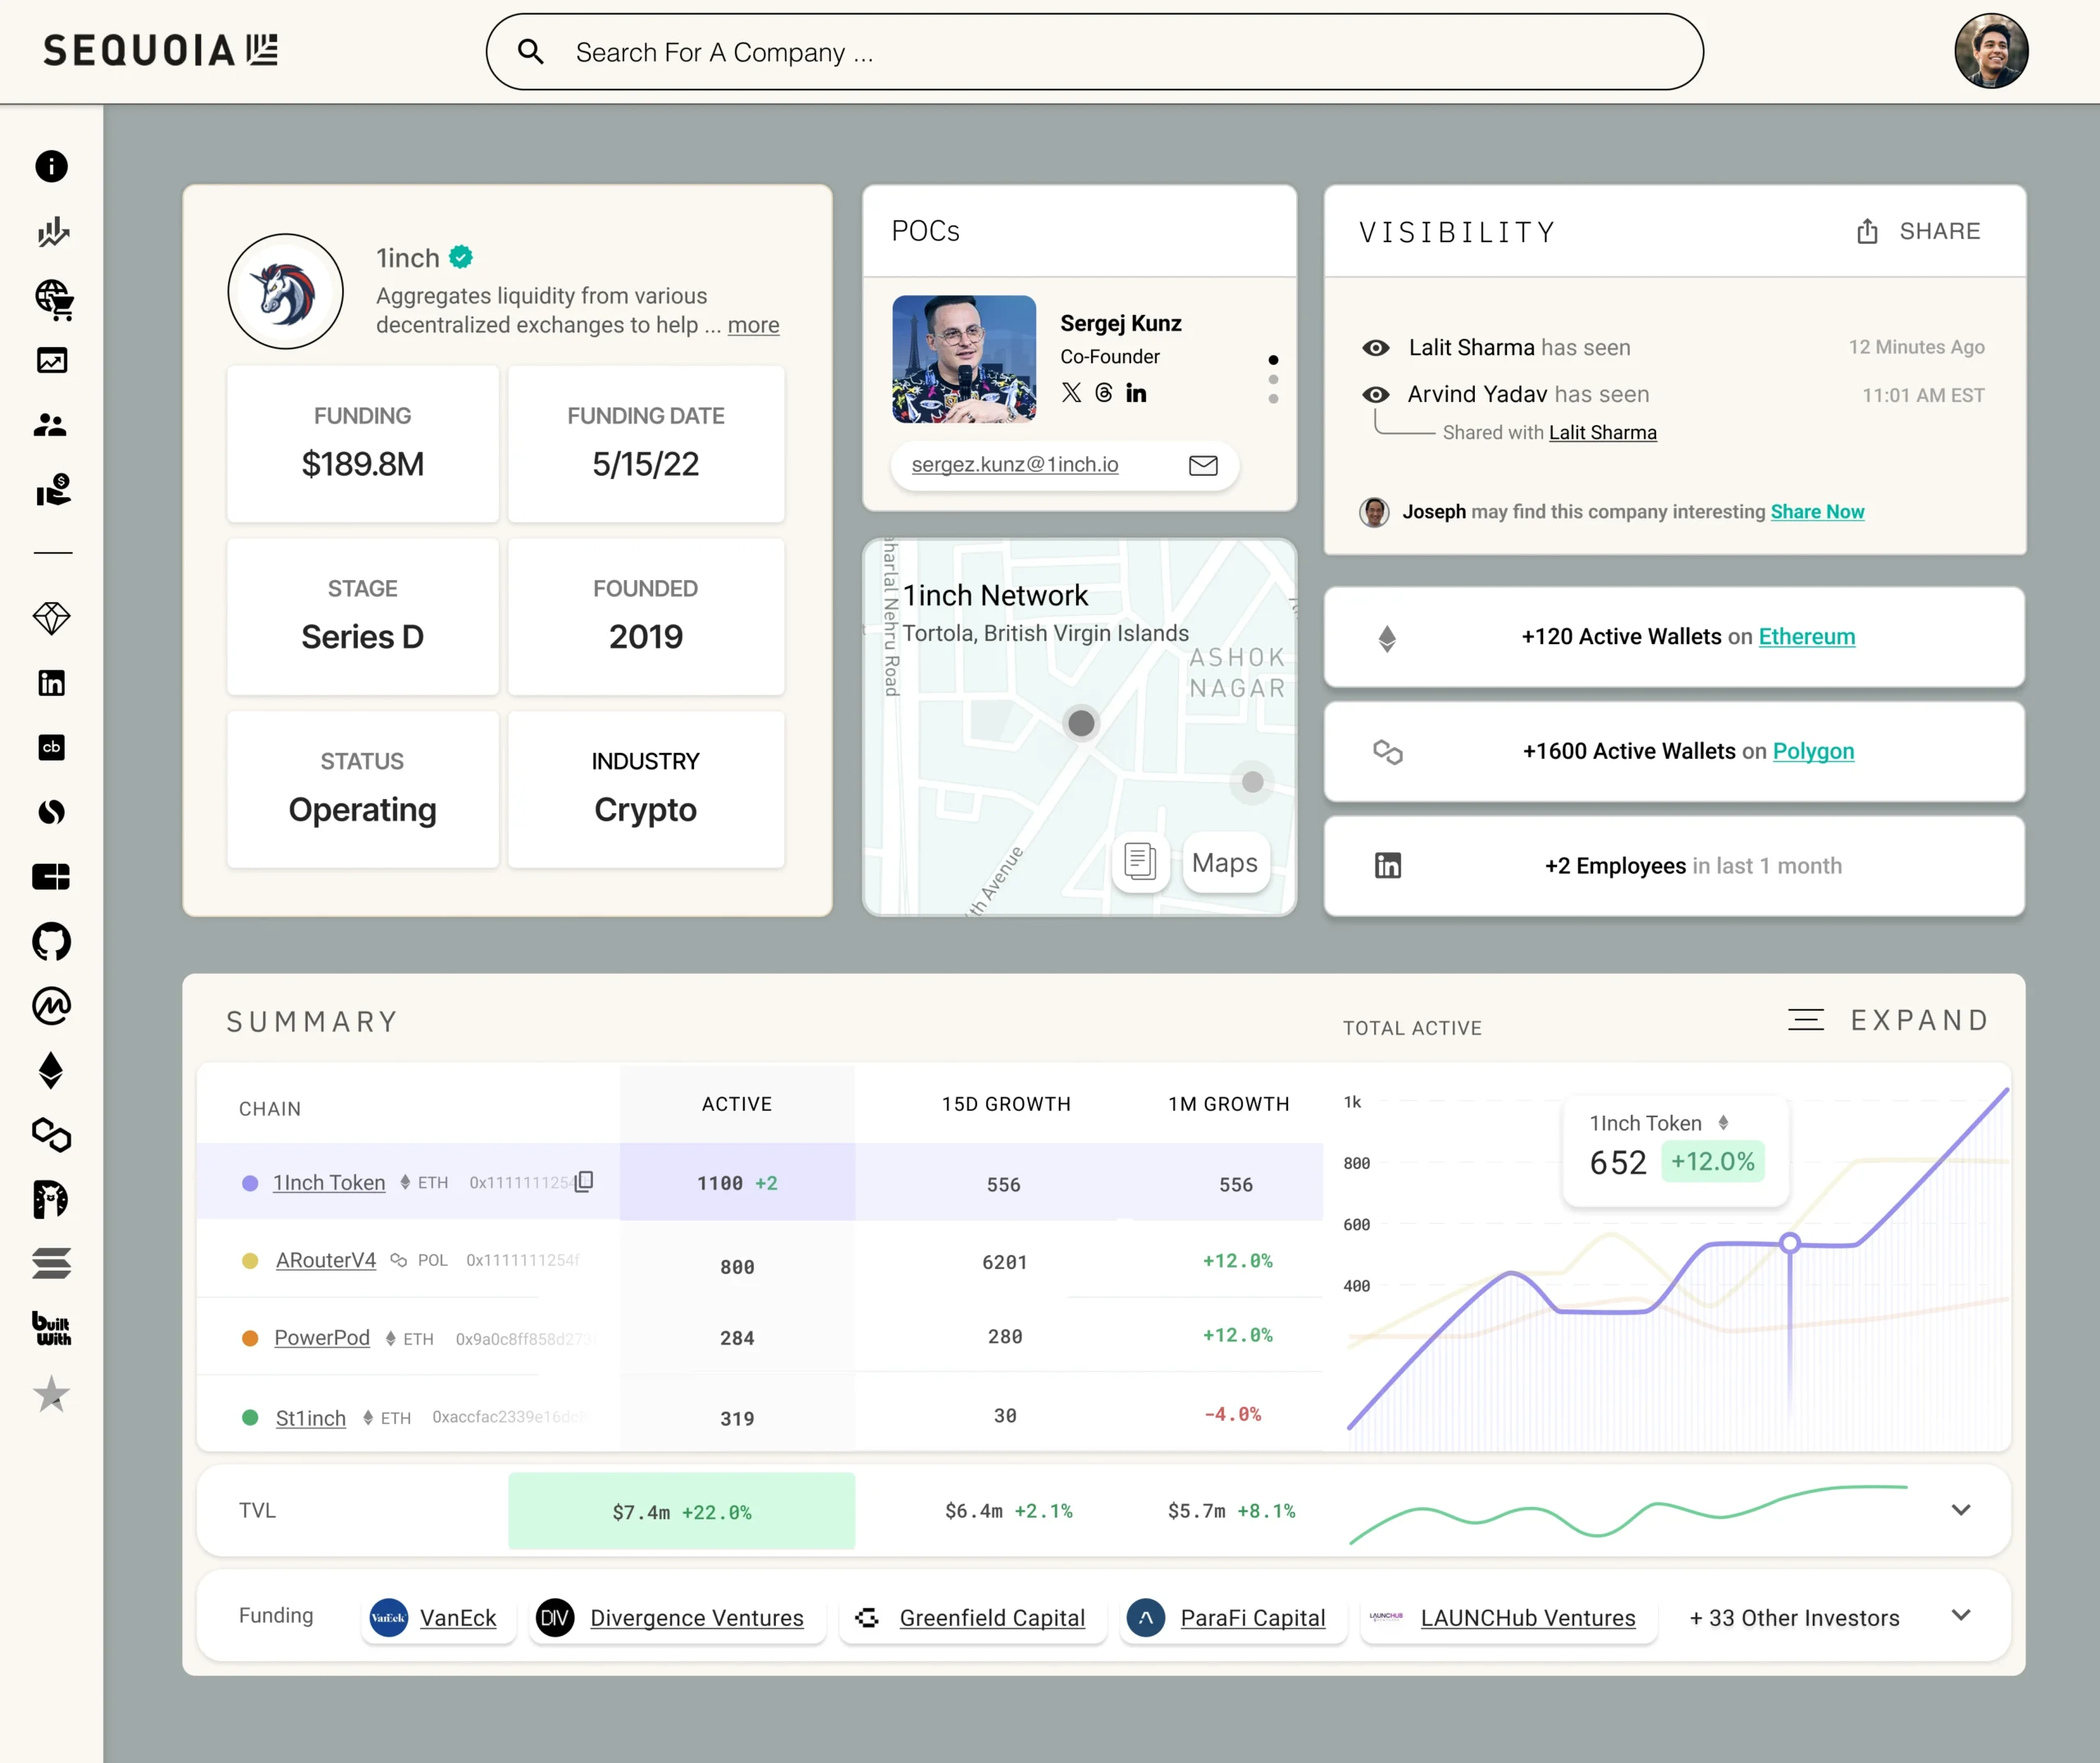
Crypto Company Detail View
The most important piece to the puzzle was the way in which Company’s themselves were being represented, what were the metrics, and what has been the timeline of interaction. Investor time was very valuable so within 15 minutes everything needed to be communicated above the fold with data represented based on utmost relevance.